Create a Plant Operator Tableau
Scenario: The user wants to display the most important information on a plant operator tableau and operate it from the tableau.

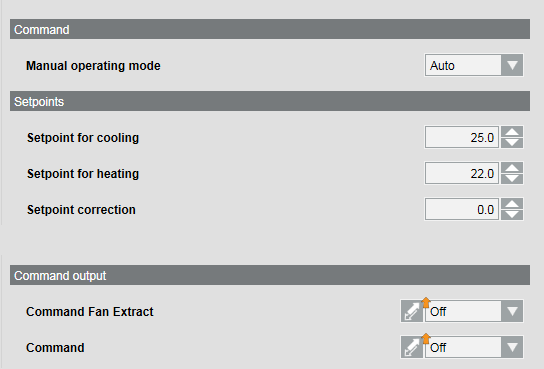
The generic design of the plant operator tableau can easily compile information on a graphic page.
Reference:
For background information, see the Graphic Pages on a Project section.
Flowchart:

Prerequisites:
- System Manager is in Engineering mode.
Steps:
1 – Select a Sample Graphic
- The Graphics Editor is opened.
- Click Open
 .
.
- Select [system] > Libraries > [L1-Headquarters] > BA > HVAC > Sample Graphics.
- Select page Setpoin_Group_Sample_001.
- Click Open.
- Click Save As
 .
.
- Select [system] > Graphics > [plant name] and enter a file name.
- Click Save.
- The plant operator tableau is saved, but not yet configured.
2 – Create a Group Title
- The plant operator tableau graphic page is opened.
- Select the View tab.
- Select the Properties check box.
- Select the symbol for the plant operator tableau.
- The Properties dialog box displays.
- In Row 00 Title, enter the name of the group, for example Plant control.
NOTE: Additional titles must be entered in the title row.
- The group title is displayed in the plant operator tableau
3 – Create Plant Operation
- The group title "Plant control" is created.
- In System Browser, select logical view.
- Select Logical > [network name] >...> [MyAhu].OpModMan.
- Drag the plant point object to Row 01 Reference.
- In Row 01 Type, enter the value 1 for multistate object.
4 – Create the Setpoint
- A new group title with the name Setpoints is created in the next available row (see Step 2).
- In System Browser, select logical view.
- Select Logical > [network name] >...> [MyAhu].[Setpoint].
- Drag the corresponding setpoint to Row 04 Reference.
- In Row 04 Type, enter the value 0 for an analog object.
- Repeat Steps 2 to 4 for all setpoints in this group.
5 – Add an Empty Line
Scenario: An empty line is required after an entry.
- In Row 07 Type, enter the value 2.
6 – Create Outputs
- A new group title with the name Outputs is created in the next available row (see Step 2).
- In System Browser, select logical view.
- Select Logical > [network name] >...> [MyAhu].[Setpoint].
- Drag the output object to Row 08 Reference.
- In Row 08 Type, enter the value 1 for multistate object.
- Scroll to the lower part of the Properties dialog box.
- In Row 08 Command, enter the value WritePrio08.
NOTE: The value is based on the applicable Subsystem object model.
- In Row 08 CommandRelease, enter the value ReleasePrio08.
Note: The value is based on the applicable Subsystem object model.
- In Row 08 DisplayRelease, enter the value 1.
- In Row 08 Parameter, enter the value Value.
- Repeat Steps 2 to 9 for all outputs in this group.
7 – Link the Graphic to the Data Point
Scenario: The plant operator tableau to be displayed if the plant is selected in System Browser.
- In System Browser, select logical view.
- Select Logical > [network name] >...> [MyAhu].
- Drag the object to line 00_Linked Datapoint.
NOTE: You can designate the display sequence if multiple graphics are assigned to the same data point.
- Click Save
 .
.
8 – Change the Font Color

- In line SetpointDescriptionColor, enter the value in characters, (Red, White, Blue) or enter the color code directly, for example, #FF622962. NOTE: The color code can be copied from the Brush Editor dialog.
- Click Save
 .
.
Information

NOTE:
The print is inverted for black and white.
